Managed business intelligence for smaller organizations

Ask your business
anything.

Get better answers. See them clearly.
Make smarter decisions—faster.

Owner Insights AI turns complex financial, sales and operational information into clear answers, useful visualizations and practical recommendations—so you can understand what is happening and decide what to do next.

Why is revenue rising while cash is getting tighter?Who generates the most revenue—and the most profit?Where will we finish the year at our current run rate?
The missing piece
AI POWERED

Your business has the data. Now get the answers.

For small and micro business owners

We use AI to connect the information you already have to the questions you need answered.

See the example answers
For businesses like yours

Can a small business afford this?

Yes, even a micro business can use the AI product. Getting it ready is a separate, hands-on service: we work with you or your bookkeeper to gather data securely, set up questions, and test the answers. Setup generally takes two to three months. Afterward, you can update your data yourself or have our team update and check it each month.

Micro business

Under $1m

Annual revenue · choose the product with self-managed data updates.

Small business

$1m–$5m

Annual revenue · use your team or ours to keep answers current.

Growing business

$5m–$20m

Annual revenue · expand questions across reports and roles.

Revenue bands are examples, not eligibility rules. Setup scope depends on your data; monthly data management is optional.

You may be surprised how accessible the product is once the setup is done.Ask about setup and options →

What could you ask?

Get a quick answer to a specific question, or request a detailed report. Select an example to see the kind of answer Owner Insights AI can prepare from connected business information.

Illustrative business owner and colleague reviewing business information on a tablet in a warehouse
These reports use fictional Acme Kitchens financial data through June 2026. The interactive Acme Kitchen & Appliance dashboard farther down the page is a separate illustrative scenario with different sample figures.
How much profit did we make in the latest month available?See a quick answer from the monthly profit reportReveal answer
Owner Insights AIAcme · sample report
Quick answer

Profit in the latest available month

June 2026 · fictional data

$150,642.16Net profit (net income) · June 2026
$750,916.45Recognized revenue
20.1%Net profit margin

The answer: Acme made $150,642.16 in net profit in June 2026, the latest month available in this sample data.

Period check: This fictional example has actuals through June 2026. This example uses the latest available month in the dataset. Net profit means income after costs, operating expenses, depreciation, interest, and the income tax provision.
Which salesperson generated the most revenue?See the answer from the salesperson reportReveal answer
Owner Insights AIAcme · sample report
Business intelligence report

Highest revenue by salesperson

Recognized revenue · January 2022 through June 2026 · fictional data

Owen HartleyTop salesperson
$6.22 millionRecognized revenue
25.1%Share of sales attributed to salespeople

The answer: Owen Hartley generated the most recognized revenue in the period.

Basis: Ranked by recognized revenue in the Acme fictional demonstration data. Recognized revenue differs from invoices issued and cash received. Rounded values are shown for quick reading.
Which direct product sales line had the highest profit margin?See the answer from the sales-line reportReveal answer
Owner Insights AIAcme · sample report
Business intelligence report

Highest direct product sales margin

Contribution profit margin · January 2022 through June 2026 · fictional data

CountertopsHighest-margin direct product line
41.0%Contribution profit margin
$576,705Contribution profit, rounded

The answer: Direct countertop sales had the highest contribution profit margin of the direct product lines.

Basis: Contribution profit divided by recognized revenue for direct product sales. Countertops sold within larger remodeling projects are included in those project lines, not this direct-sales comparison.
How much revenue came from kitchen remodels?See the answer from the project-line reportReveal answer
Owner Insights AIAcme · sample report
Business intelligence report

Kitchen remodel revenue

Recognized revenue · January 2022 through June 2026 · fictional data

$12.18 millionKitchen remodel revenue
Kitchen remodelsProject line

The answer: Kitchen remodel projects generated $12,180,645 in recognized revenue over the period.

Basis: Acme fictional demonstration data, grouped by engagement line. This includes work sold as a kitchen remodel and does not separately allocate each included product.
Need the full picture? You can get a detailed profit and loss report as well as quick answers. Open this example to see the figures, month-by-month results, and a short explanation.
Show me a full profit and loss report for the business.See a detailed January–June 2026 P&L and monthly breakdownReveal report
Owner Insights AIAcme · detailed sample report
Full profitability report

Profit and loss | Acme

January 1–June 30, 2026 · compared with January–June 2025 · fictional data

$3,025,750Recognized revenue · up 24.8% year over year
$1,240,557.50Gross profit · 41.0% gross margin
$110,298.58Net profit · 3.6% net margin

What changed: Revenue rose $600,440.05 from the same six months in 2025. Acme moved from a $118,310.15 net loss to a $110,298.58 net profit. June was the strongest month in this period, with $150,642.16 in net profit; the six-month total is lower because January and February had losses.

Profit and loss statement

January through June in each year. Costs and expenses are shown as positive amounts deducted from the preceding line. Parentheses indicate a loss or a decrease.

Line item2026 actual2025 actualChange
Recognized revenue$3,025,750.00$2,425,309.95$600,440.05
Cost of goods sold$1,785,192.50$1,431,293.56$353,898.94
Gross profit$1,240,557.50$994,016.39$246,541.11
Attributed costs below gross profit$34,606.57$42,041.58($7,435.01)
Contribution profit$1,205,950.93$951,974.81$253,976.12
Other operating expenses before D&A$997,174.17$981,631.88$15,542.29
EBITDA$208,776.76($29,657.07)$238,433.83
Depreciation and amortization$50,000.00$46,530.62$3,469.38
Interest expense$18,000.00$15,183.68$2,816.32
Income tax provision$30,478.18$26,938.78$3,539.40
Net profit (net income)$110,298.58($118,310.15)$228,608.73

Month-by-month results

This shows how the six-month net result developed. Monthly net profit can be positive even when earlier losses reduce the year-to-date figure.

2026RevenueGross profitEBITDANet profitNet margin
January$117,673.50$47,196.69($114,019.05)($129,406.26)(110.0%)
February$415,028.36$169,751.98$8,536.24($6,850.97)(1.7%)
March$665,964.12$255,682.84$83,719.38$67,306.3510.1%
April$576,080.59$214,041.71$42,078.25$25,665.224.5%
May$500,086.98$203,092.10$20,380.93$2,942.080.6%
June$750,916.45$350,792.18$168,081.01$150,642.1620.1%
January–June$3,025,750.00$1,240,557.50$208,776.76$110,298.583.6%

How to read this: Gross profit is revenue less cost of goods sold. Contribution profit additionally deducts attributed costs below gross profit. Other operating expenses exclude those attributed costs, so they are counted once. EBITDA is before depreciation and amortization, interest, and the income tax provision. Net profit is after all of these line items.

Basis: Acme fictional demonstration financial data, actuals through June 2026. Figures reconcile to the demonstration profit and loss and monthly financial summaries. This is an example of a prepared report, not a live report generated from a visitor’s data.

Acme is fictional and these five example reports are prepared in advance. You can send a question about Acme; this page does not run live queries against its data.

Want to see the complete analysis?

Explore seven detailed reports, including six based on Acme’s simulated business records and an illustrative tax-planning scenario with questions for a CPA.

See Example Reports
What questions would you ask about your own business?Talk to us about your business
One intelligence systemConfigured for ownersCPAscontrollers & CFOsbookkeeperssales managers

Two ways to use your answers

Ask in your GPT account.
Or see it on your own dashboard.

We organize the information you provide and check important calculations against those records. Then you can ask questions through a plugin in your GPT account, or choose a custom dashboard for a visual view of the information that matters to you. We can provide either option or both.

We test answers before a client launch, but AI can still be wrong. Read how we handle accuracy.

01

Use your GPT account

We provide a plugin connected to the information prepared for your business. Ask specific questions in your own GPT account and get clear answers without needing a separate dashboard.

See example questions and answers →
02

Add a custom dashboard

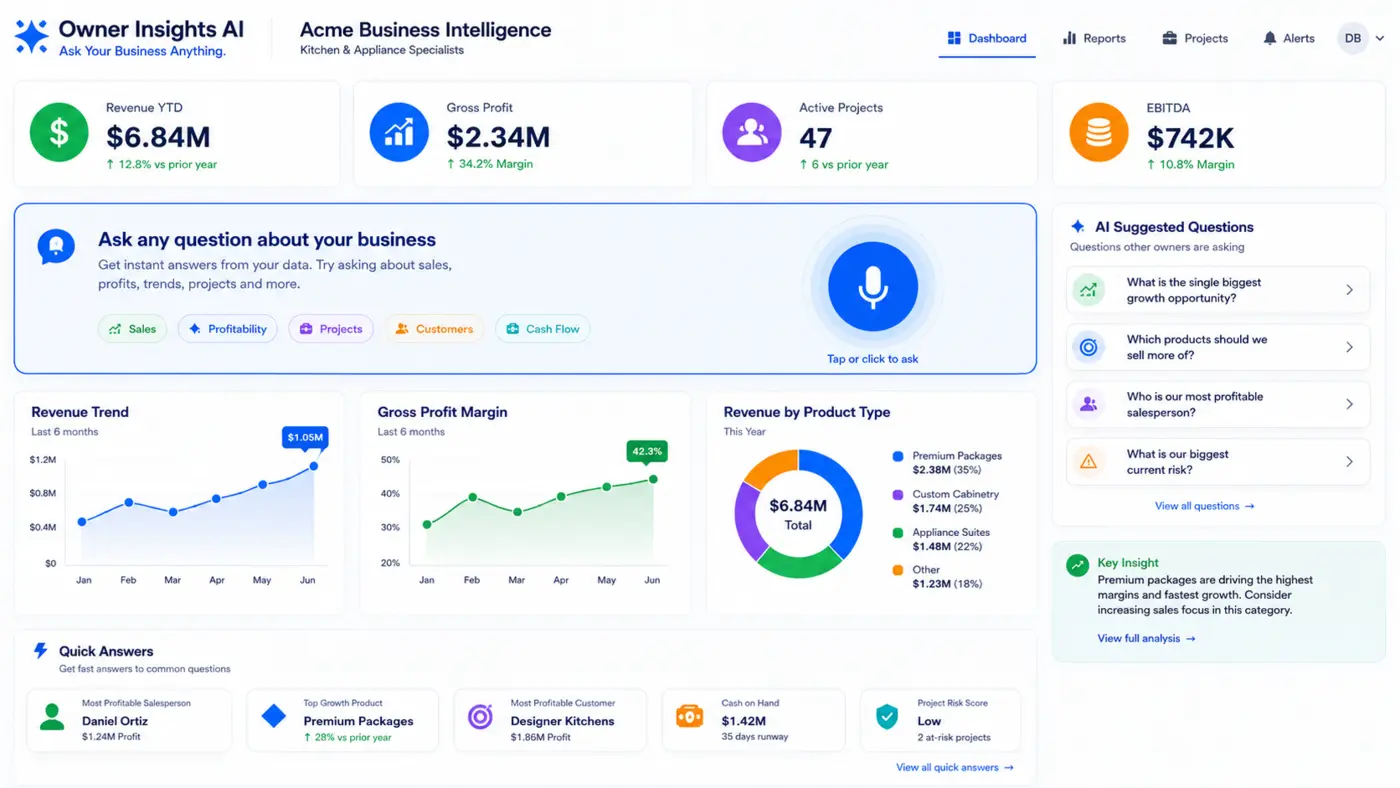
For an at-a-glance view, we can build a dashboard around your figures, recurring questions and the roles in your business. The Acme example shows one possible design; your dashboard would be tailored to you.

Discuss a dashboard for your business →
ILLUSTRATIVE DASHBOARDAcme Kitchen & Appliance
Illustrative Acme dashboard showing revenue, gross profit, projects, charts and suggested business questions
Fictional Acme example. This is a visual preview, not a working dashboard. A client dashboard is built and tested around that business’s own data.

Different responsibilities. Different questions.

A different dashboard
for each person.

If you choose a dashboard, we can build views around the questions each authorized person needs answered and the decisions they are responsible for. Access can be limited to the information appropriate to each role.

One business. Different views for each role.An owner, CPA, controller or sales manager can each have a view tailored to their responsibilities. The Acme preview above is one possible design, not a fixed template every client receives.
OWN
TAILORED DASHBOARD FORBusiness owner
Proportionate access

THE PROBLEM TO SOLVE“I have reports, but I still cannot see what is really driving profit.”

QUESTIONS THIS PERSON COULD ANSWER

01How profitable are we—really?→

02What will make the biggest difference this year?→

03Can we afford the next hire?→

✓
DECISION UNLOCKEDA complete view of financial health, opportunities, risks and what-if decisions.

A practical example

The top seller
wasn’t the most profitable.

Acme’s owner asks the sales manager who is performing best. The obvious answer is Maya, because she produces the most revenue. But once Owner Insights AI connects sales to products, discounts, gross margins and post-sale adjustments, the more useful answer is Daniel.

That changes the management decision. Instead of simply telling everyone to sell more, Acme can examine Daniel’s product mix and sales process—and teach the rest of the team what is actually producing profit.

See the example answers →
SM
SALES MANAGER VIEWAcme Kitchen & Appliance
Role-based access
ASK ANY QUESTION

Who is our most profitable salesperson?

✦
ANSWER

Daniel Ortiz creates the most gross profit, although Maya Chen has the highest revenue.

TOP REVENUEMaya Chen$2.18M
TOP GROSS PROFITDaniel Ortiz$716K
Calculated from sales + product + margin data
1
ASKWho creates the most gross profit?
2
UNDERSTANDDaniel—not Maya—creates the most profit
3
DECIDEReplicate the profitable product mix

Question-first implementation

We do not begin
by connecting everything.

We can help identify useful first questions, even if you are not sure what to ask. They guide the first data and calculations to prepare; they do not limit the questions you can ask later.

Business owner moving from complicated spreadsheets to clear visual business intelligence and understandable answers
FROM DATA OVERLOADto answers you can see, understand and act on
✦
ANSWER VISUALIZEDProfit by salesperson
01

Define the decisions

Identify the owners, advisors and managers who need information—and the decisions they are responsible for.

02

Specify the questions

Agree on questions such as profitability, product mix, forecasts, hiring scenarios and exceptions.

03

Build the data foundation

Bring together and organize the accounting, sales, customer, project and operational information your team provides.

04

Configure each experience

Create role-specific dashboards, reports, suggested questions and permissions, then test the answers.

See how the full process works
QUICKBOOKS MAY BE ONE SOURCEThe business is bigger than its accounting system.

Useful answers may also require CRM records, salesperson and product data, project information, payroll, spreadsheets, forecasts and industry-specific systems. We organize what the questions require.

More than access to an AI tool

Powerful AI still needs
a business-specific implementation.

OpenAI’s financial services and data tools can provide impressive analysis. Our work is to make that capability useful for one organization: discover its questions, prepare the right information, define the calculations, test the answers and help people use the result.

See how Owner Insights AI fits with these tools →

A useful question for the owner

What might we owe in tax, and what can we still do?

Project your probable tax position, look for lawful options to discuss and bring a clearer brief to your CPA. Explore plain-language questions for service, product and multistate businesses.

Explore business tax planning

From question to decision

See what a useful
answer looks like.

These examples show the difference between reporting a number and providing the context needed to act on it.

A
Acme IntelligenceFinancial, sales and operational data combined
Illustrative scenario
QUESTION

Who is our most profitable salesperson—not merely our highest seller?

✦DECISION-READY ANSWER

Maya leads revenue, but Daniel creates the most gross profit. In this illustrative comparison, his 33.0% gross margin is 7.4 points higher than Maya’s 25.6%. His product mix is worth investigating before changing the team’s approach.

+7.4 ptsDaniel’s illustrative gross-margin advantage
ACME · ILLUSTRATIVE SCENARIO

Revenue is not the same as gross profit

This example shows the inputs and calculation behind the selected answer. Acme Kitchen & Appliance is fictional; these scenario figures are separate from the five Acme Kitchens sample reports above.

Illustrative inputs and results
MeasureFigureBasis
Maya Chen · revenue$2.18MIllustrative sales total
Maya Chen · gross profit$558K$2.18M × 25.6%
Daniel Ortiz · revenue$2.17MIllustrative sales total
Daniel Ortiz · gross profit$716K$2.17M × 33.0%, rounded
How the example is calculated

33.0% − 25.6% = 7.4 percentage points higher gross margin.

What would need checking with a real business: Before making a real decision, reconcile each salesperson’s sales, direct costs, discounts, returns and post-sale adjustments.

HOW VOICE QUESTIONS COULD WORK

Ask your business aloud.

In a voice-enabled client dashboard, you could tap the microphone and ask, “Who is our most profitable salesperson?” The answer would use that business’s prepared information, with supporting figures available to inspect.

This is an illustration. The microphone here does not listen, record audio or send a live question.

Flexible financial support

Keep your bookkeeper.
Or use ours.

Either path gives Owner Insights AI the reliable, maintained financial foundation it needs.

See how our own need for faster answers led to Owner Insights AI →
01WORK WITH YOUR TEAM

You already have a bookkeeper

We work with your existing bookkeeper or financial team to obtain, organize and maintain the information Owner Insights AI requires.

Your bookkeeper stays in place
02ONE MANAGED SERVICE

You need bookkeeping support

We provide the bookkeeping foundation and Owner Insights AI together, keeping the underlying information current, organized and ready to answer your questions.

Bookkeeping + business intelligence

Better answers. Clearer decisions.

What would you ask
if the answers were easy?

Tell us which decisions are difficult, who needs the answers and where the relevant information currently lives. We’ll determine what an Owner Insights AI implementation would require.

?
START WITH A REAL QUESTIONWhat do you need to know?

Why is revenue growing while cash is getting tighter?

Which customers, products or services are most profitable?

What would hiring another person do to our cash flow?

Request a Quote →See the two ways to use it ↑